Cost, Capacity and Sustainability of AI
This chapter treats cost and energy as architectural constraints of AI systems rather than as bills that arrive after the design is finished. It extends the cost optimisation discipline of Architecture as Code (Chapter 15B) (72, Nordqvist, 2025), where budgets and tagging are declared in code and enforced by pipelines, to the specific economics of models: token-based pricing, scarce accelerators, and an energy footprint now visible to regulators, investors, and citizens. It covers inference cost, GPU capacity, cost levers, FinOps, and carbon accounting with the Software Carbon Intensity specification (30, Green Software Foundation, 2024).
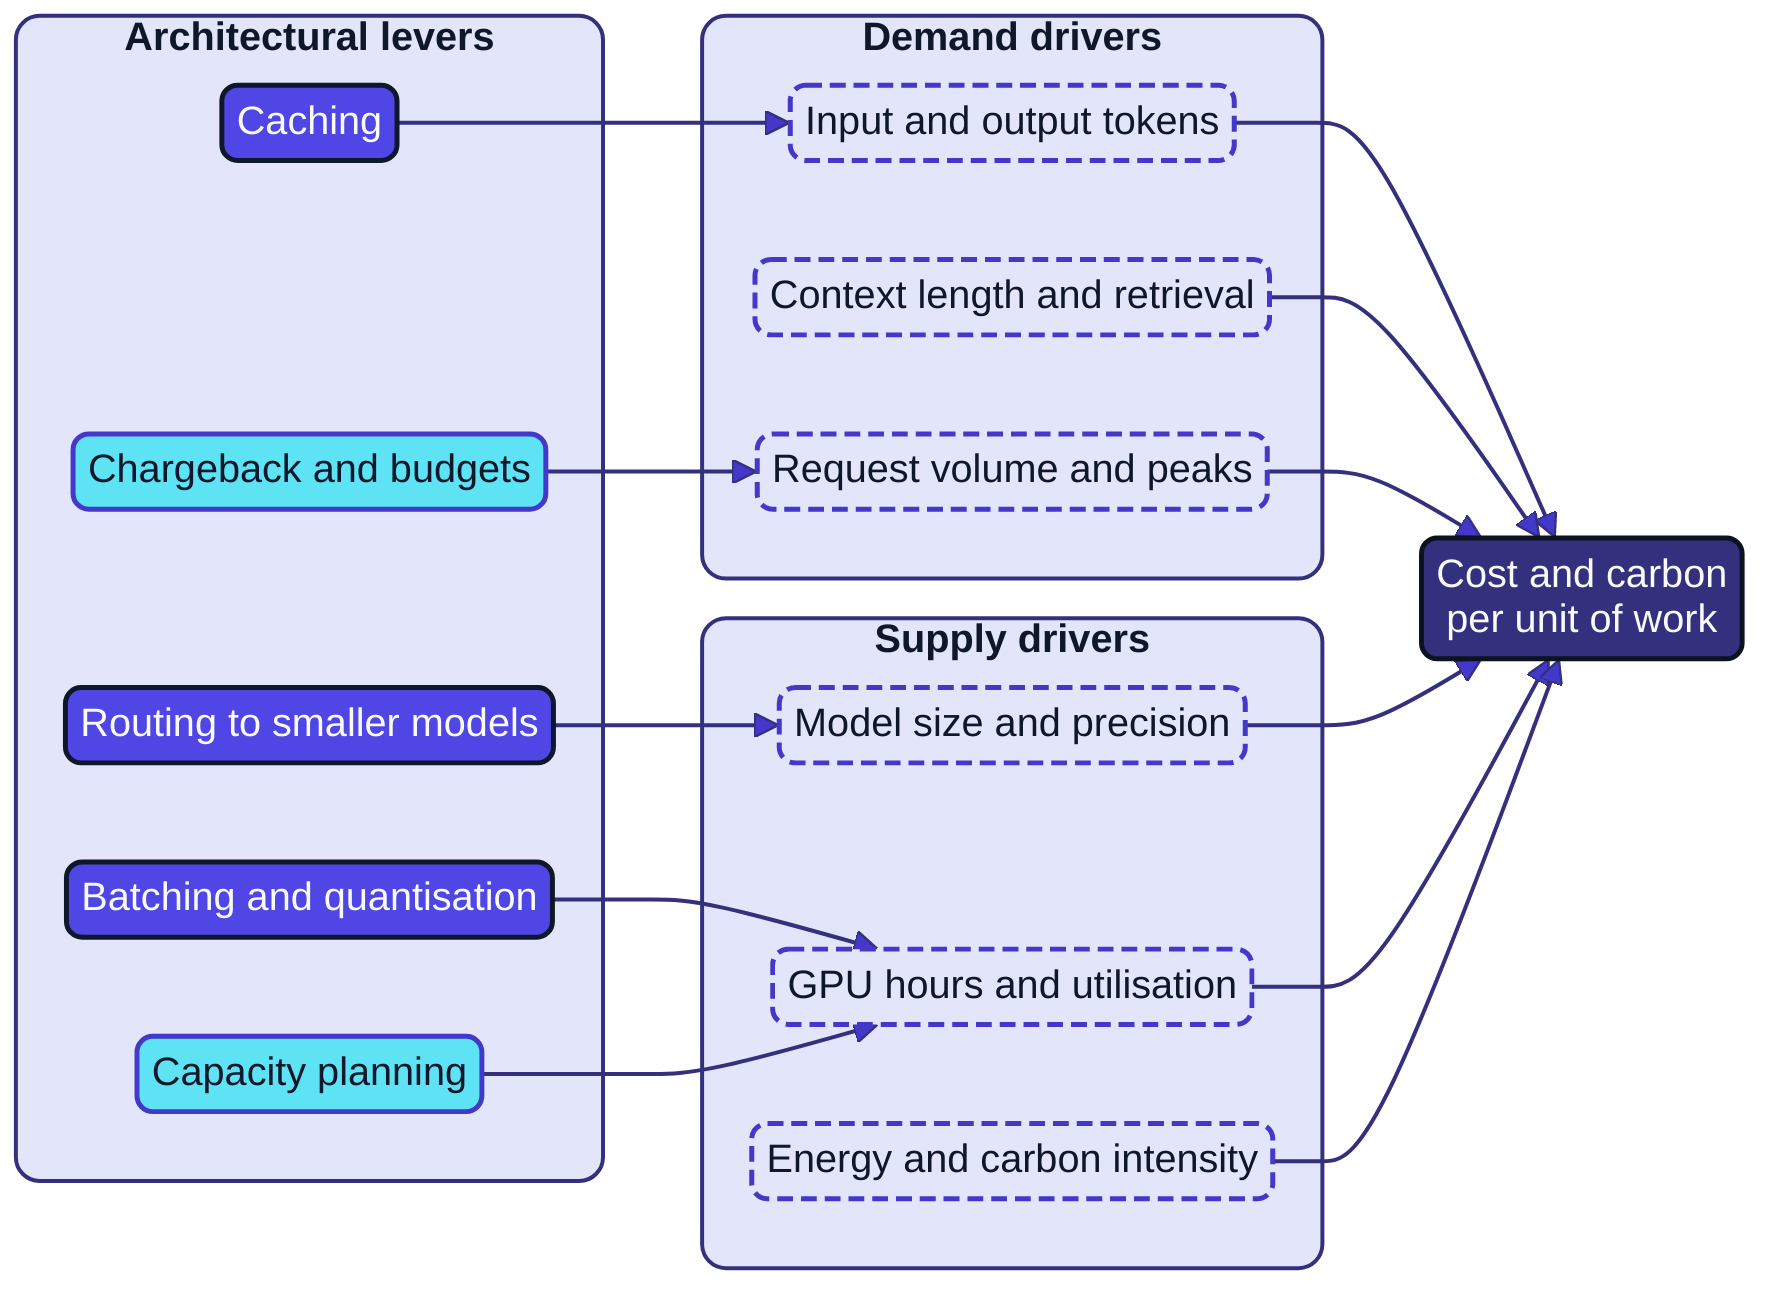
Figure 22.1: Cost and carbon per unit of work are driven by demand factors such as tokens, context, and volume, and by supply factors such as model size, GPU utilisation, and energy intensity; caching, routing, batching, capacity planning, and chargeback each act on a specific driver.
Cost as an architectural constraint
Architecture as Code argued that cost is an architectural characteristic like availability or security: it has fitness functions, it is measured continuously, and a design that ignores it is incomplete. AI sharpens the argument. Inference cost scales with usage, so a successful feature can become unaffordable; the hardware is scarce and expensive, so capacity decisions are made months ahead and are hard to reverse; and energy consumption is large enough to be a reporting matter, so a design decision is counted in kilowatt-hours and carbon as well as in euros.
The response is the same as for any other characteristic: declare the constraint in a cost policy under version control, measure it through telemetry attributed to system, team, and use case, enforce it through pipeline gates and runtime controls, and design for it through the levers in Figure 22.1. Principle eight in AI Governance, Chapter 4, sustainability and cost as design constraints, is the statement of intent; this chapter is its implementation.
Token economics and inference cost models
A hosted LLM is priced per token, with separate rates for input and output, and sometimes a reduced rate for cached input (181, Patil, 2026). Output tokens cost more because each requires a full forward pass, while input tokens are processed in parallel (181, Patil, 2026). The cost of a request is therefore roughly input tokens times the input rate plus output tokens times the output rate, multiplied by request volume for the system.
Each term is an architectural decision. Input tokens come from the system prompt, the retrieved context in a retrieval-augmented generation (RAG) system, the conversation history, and the user's message; a two-thousand-token system prompt sent with every request is a fixed cost nobody chose deliberately, and a retrieval step that returns ten chunks when three would ground the answer doubles the variable cost. Output tokens depend on response length and hidden reasoning; request volume on retries and agentic patterns in which one user action produces a dozen model calls.
For self-hosted models the drivers are the same, but cost is the amortised hardware and energy of the GPU hours consumed, which depend on model size and precision, tokens processed, and utilisation. Luccioni, Jernite, and Strubell (49, Luccioni et al., 2024) measured inference energy across tasks and models and found that multi-purpose generative models consume substantially more energy per task than smaller task-specific models, with image generation the most energy-intensive task measured. Their finding points directly at the routing lever: a general-purpose model is the expensive default, and most requests do not need it. Training and fine-tuning, finally, are one-off costs amortised over a model's useful life, which Chapter 21 showed is shortened by drift.
| Component | Driver | Who controls it |
|---|---|---|
| Input and output tokens | Prompt, retrieved context, history, response length | Prompt, retrieval, and schema design |
| Request volume | User interface, retries, agent step count | Application and agent design |
| Model unit cost | Model size, precision, provider pricing | Routing policy, sourcing |
| GPU hours | Utilisation, batching, idle capacity | Capacity planning, serving configuration |
| Training and fine-tuning | Frequency, dataset size, model size | Lifecycle policy |
| Energy and carbon | Hardware efficiency, grid carbon intensity | Infrastructure placement |
Across the usage modes
The token formula describes the organisation's own bill only where it calls a model itself. Elsewhere the mode decides how cost arises and which levers the organisation holds, as the table shows against Chapter 2's usage-mode matrix.
| Usage mode | Typical pricing | Where the cost levers sit |
|---|---|---|
| Mode 0 Ambient AI | Bundled into licences, often as a price uplift at renewal | Renewal negotiation, opting out of features |
| Mode 1 Conversational assistants | Per-seat licence | Number of seats, tier, retiring unused seats |
| Mode 2 Embedded workplace assistants | Per-seat add-on to the office suite | Which groups get the add-on, measured adoption |
| Mode 3 Agentic work tools | Per seat plus consumption above an allowance | Per-user consumption caps, model choice per task |
| Mode 4 Built AI applications | Consumption per token or GPU hour | Prompt and retrieval design, routing, caching, batching |
| Mode 5 Autonomous production agents | Consumption, multiplied by agent step count | Step and budget limits, loop termination |
The rest of this chapter concerns mainly Modes 4 and 5, where the organisation controls every driver. In Modes 0 to 2 the lever is commercial, a renewal decision informed by seat utilisation telemetry. Mode 3 most often surprises the budget holder, because a per-seat price with an allowance behaves like a licence until a few heavy users push it into consumption billing; per-user caps and showback by team keep it bounded.
Capacity planning for GPUs
Chapter 13 described the scarcity of accelerators in Europe and its sovereignty questions; here the question is how much capacity to acquire, in what form, and how to use it well. Interactive workloads such as chat and decision support have sharp daily peaks and strict latency expectations, whereas batch workloads such as document classification or nightly embedding refreshes need only meet a deadline. Sizing for the interactive peak and leaving capacity idle at night is the most common mistake; scheduling batch work into the troughs raises utilisation sharply, and utilisation is the largest determinant of cost per request for self-hosted models (181, Patil, 2026).
Three further decisions shape the plan. Reserved capacity is cheaper per hour than on-demand but is paid for whether or not it is used, so the mix depends on how predictable the baseline is. Quantisation reduces memory and compute per token at some cost to quality, which the evaluation suite of Chapter 20 must measure before adoption. And location determines latency, jurisdiction, and the carbon intensity of the electricity. Capacity is also a governance matter: GPU hoarding, where teams reserve accelerators against future need and leave them idle, is an anti-pattern catalogued in AI Governance, Chapter 20, and the remedy is a shared platform with transparent allocation and chargeback, so that an idle GPU has a visible owner and cost.
Worked example: GPU capacity plan
Illustrative example. Nordvik Region runs two open-weight models on accelerators that a European hosting provider reserves for it in a Nordic data centre, and bursts to on-demand capacity for the citizen-facing peak. The plan is reviewed quarterly, and every figure is derived from the previous quarter's gateway telemetry.
# capacity/benefits-platform-2027q1.yaml
apiVersion: capacity.aiarch.example/v1
kind: GpuCapacityPlan
metadata:
  name: benefits-platform-2027q1
  owner: ai-platform-team
  approvedBy: head-of-benefits-digital
  basedOn: telemetry/2026q4-demand-profile.json
demand:
  interactive:
    peakTokensPerSecond: 42000
    latencyObjectiveP95Ms: 1800
  batch:
    dailyTokens: 310000000
    window: "18:00-06:00 CET"
supply:
  reserved:
    location: eu-north-1
    gpuCount: 16
    commitmentMonths: 12
    costPerGpuHourEur: 1.85
  onDemand:
    maxGpuCount: 8
    costPerGpuHourEur: 3.40
    trigger: interactive queue time above 400 ms for 5 minutes
utilisationTargets:
  reservedAverage: 0.70
  reservedFloorAlert: 0.45
  scheduling: batch work admitted only when interactive load below 60 percent
exit:
  reservationRenewalDecision: "2027-11-15"
  fallbackIfNotRenewed: hosted provider via gateway route medium-eu-hosted-32b
Reserved capacity is sized for the baseline, with expensive burst capacity used only when latency is at risk. The utilisation floor alert turns GPU hoarding into a visible finding, and the renewal date, two months before the commitment ends, leaves time to tender the next reservation.
Architectural levers: caching, routing, and batching
Three of the levers in Figure 22.1 are serving-layer patterns that belong in the AI gateway from Chapter 12. Caching reduces input tokens and request volume. Chapter 12 set out exact-match and semantic caching with their safeguards; for cost, exact-match caching pays most in public-facing services where questions recur, and the similarity threshold of a semantic cache is an evaluation question, not a configuration default. Prefix caching, which reuses the computation for a shared system prompt, rewards keeping that prefix stable.
Routing reduces model unit cost. Most requests are simple, and a small model answers them as well as a large one. A routing policy classifies each request by use case, a complexity estimate, or an explicit declaration from the calling application, and sends it to the cheapest model that meets the quality objective from the evaluation suite. The following configuration serves the social insurance authority introduced in earlier chapters.
apiVersion: gateway.aiarch.example/v1
kind: ModelRoutingPolicy
metadata:
  name: benefits-services-routing
  owner: ai-platform-team
  costPolicyRef: policies/cost/benefits-services.yaml
defaults:
  model: small-eu-hosted-8b
  maxOutputTokens: 400
routes:
  - name: faq-and-navigation
    match:
      useCase: citizen-faq
    model: small-eu-hosted-8b
    rationale: Evaluated at 0.98 grounding rate on the FAQ scenario set
  - name: complex-explanation
    match:
      useCase: eligibility-explanation
      complexityScoreAbove: 0.7
    model: large-provider-model
    maxOutputTokens: 1200
    requiresApproval: cost-owner
  - name: batch-classification
    match:
      useCase: document-classification
      mode: batch
    model: classifier-fine-tuned-v4
    schedule: off-peak
    batchSize: 256
fallback:
  onBudgetExhausted: small-eu-hosted-8b
  onProviderUnavailable: medium-eu-hosted-32b
Each route names its evidence, and the fallback makes behaviour under budget exhaustion explicit, which is the difference between a cost policy and a cost surprise.
Batching reduces GPU hours. At low load a GPU waits on memory transfers and cannot fill its execution pipeline, so the cost per token falls steeply as more requests are processed concurrently (181, Patil, 2026). The serving stack can batch continuously across concurrent interactive users, batch workloads run with large batches off-peak, and quantisation lowers the cost per token further: in one measurement FP8 reduced the effective cost at every arrival rate tested (181, Patil, 2026).
FinOps for AI and chargeback
FinOps makes cloud spending visible, attributable, and governable by the teams that cause it. For AI the unit of consumption is the token or the GPU hour, and attribution must reach through the gateway to the use case and team. The gateway records tokens, model, and cache hits per request with the calling use case and cost centre, using the attributes from Chapter 21, and a daily job compares consumption with budget. Whether the consuming team pays (chargeback) or is merely informed (showback) is a management decision; the architecture is the same.
The cost policy is enforced in the pipeline, where a change that would raise estimated cost per request beyond a threshold requires approval, and at runtime, where the gateway applies rate limits and budget caps per use case. In Nordvik Region's policy for the routing configuration above, the monthly budget is EUR 18,000 with alerts at 50, 80, and 95 per cent and a hard cap at 110 per cent; the pipeline gate allows at most a ten per cent cost increase without the cost owner's approval; the target is EUR 0.12 per resolved enquiry; and the sustainability target is 2.0 gCO2e per enquiry, evidenced under control FIN-COST-01.
Unit economics are the most useful line in such a policy. Cost per request is easy to measure and easy to misread, whereas cost per resolved enquiry, per processed claim, or per prevented fraud case relates spending to value and is the figure that a steering committee, as AI Governance, Chapter 16 describes, can act upon. Nordvik's weekly showback report shows why: the eligibility-explanation route, with the fewest requests, carries 40 per cent of spend for 13 per cent of resolved enquiries, which only becomes visible when cost is set against a unit of work.
Energy and carbon accounting
Strubell, Ganesh, and McCallum (47, Strubell et al., 2019) quantified the carbon cost of training large language models, finding that training a single large model with extensive architecture search could emit as much carbon as several cars over their lifetimes. Patterson et al. (48, Patterson et al., 2021) showed that the choice of architecture, processor, data centre efficiency, and the location and time of training together change the footprint by orders of magnitude. Their conclusion is architectural: the same model can be trained or served at very different carbon cost depending on decisions an architect controls.
The International Energy Agency's Electricity 2024 report (71, IEA, 2024) projects that electricity consumption from data centres, AI, and cryptocurrency could more than double between 2022 and 2026 in its higher scenario, and notes that data centres in the Nordic countries benefit from lower cooling demand in a colder climate and from lower electricity prices, and that Sweden and Norway may increase their share of the data centre market because almost all of their electricity is generated from low-carbon sources. Inference on the Nordic grid therefore carries a fraction of the carbon of the same inference where coal or gas dominates, but only if the architecture places the workload there, which connects sustainability to the sovereignty decisions of Chapter 13.
The Software Carbon Intensity specification
The Green Software Foundation's Software Carbon Intensity (SCI) specification, published as ISO/IEC 21031:2024 (30, Green Software Foundation, 2024), defines the carbon emissions of a software system per functional unit: energy consumed times the carbon intensity of the electricity, plus the embodied emissions of the allocated hardware, divided by the functional unit. The functional unit should be the same one used for cost, such as a resolved enquiry or a processed claim.
SCI rewards reduction rather than offsetting, so purchased offsets do not lower the score. The only ways to improve it are less energy per unit, cleaner energy, or less allocated hardware, and each maps to a lever in Figure 22.1: routing to a smaller model reduces energy, a low-carbon grid reduces intensity, and batching reduces the embodied emissions allocated per unit. That is why the cost policy carries an SCI target, measured from gateway telemetry extended with energy estimates and hourly grid carbon intensity.
Worked example: SCI calculation for a use case
Illustrative example. The calculation below covers Nordvik Region's citizen FAQ service on its reserved accelerators for October 2026, using the specification's formula SCI = ((E × I) + M) per R, where E is energy, I the carbon intensity, M the allocated embodied emissions, and R the functional unit.
# sustainability/sci/citizen-faq-2026-10.yaml
sci_calculation:
  specification: ISO/IEC 21031:2024
  use_case: citizen-faq
  period: 2026-10
  functional_unit: resolved enquiry
  boundary:
    included: [gpu servers, host cpu and memory, cooling share, gateway nodes]
    excluded: [citizen end-user devices, network transit outside data centre]
  energy:
    gpu_and_host_kwh: 1970
    pue: 1.15
    total_kwh_E: 2266
  carbon_intensity:
    source: grid-operator-hourly, location-based, weighted by hourly load
    grams_co2e_per_kwh_I: 32
  operational_emissions_g: 72512
  embodied_emissions_M_g: 62400
  functional_units_R: 71000
  result:
    sci_g_co2e_per_unit: 1.90
    target: 2.0
  sensitivity:
    same_workload_at_350_g_per_kwh: 12.05
  known_limitations:
    - Hosted large-provider-model route excluded; provider publishes no per-request energy
  reviewed_by: sustainability-lead
The record states boundary, method, and limitations, without which an SCI figure cannot be compared or defended. The sensitivity line shows the same workload on a gas-dominated grid: the score rises more than sixfold, which is the location argument expressed as a number. Precision is limited, however, because hosted providers rarely disclose per-request energy, so a deployer estimates from model characteristics and token counts and states the method. The AI Act asks providers of general-purpose AI models to document known or estimated energy consumption in the technical documentation required by Annex XI (1, European Union, 2024), which should give deployers a better basis over time and a reason to ask for the figure in procurement.
The European reporting context
Sustainability reporting in the European Union is governed by the Corporate Sustainability Reporting Directive, Directive (EU) 2022/2464, which requires large and listed companies to report greenhouse gas emissions under the European Sustainability Reporting Standards. Its scope and timing were under revision during 2025, so organisations should confirm their position with their reporting function. Either way, an organisation that reports emissions needs attributable energy data for its AI workloads, which SCI per use case supplies as a by-product.
Public authorities are outside the directive but face parallel expectations from national climate legislation, procurement criteria, and citizens, who may ask what a chatbot costs in electricity.
Public-sector budget cycles
Public authorities budget annually through fixed appropriations, with limited ability to move funds between years or between capital and operating expenditure, and AI consumption pricing fits this badly. A model billed per token is an operating cost that scales with citizen demand, so a successful service can exhaust its appropriation in the third quarter; reserved GPU capacity, by contrast, is a multi-year commitment that must survive procurement long before demand is known.
Three practices reduce the friction: the hard cap with its fallback bounds the cost, showback by use case supplies evidence for the next appropriation, and a platform shared across agencies, as AI Governance, Chapter 12 describes, pools reserved capacity so that no agency bears the fixed cost alone and utilisation is higher than any one could achieve. Procurement under Directive 2014/24/EU constrains all three, and AI Governance, Chapter 7 addresses the contractual side, including clauses on model updates and exit, and life-cycle costing.
Nordvik Region and Hansa Mutual
Nordvik Region's cost discipline is shaped by annual appropriations, which is why the hard cap and fallback matter more than unit price, and by sovereignty, which is why it runs open-weight models on reserved accelerators in a Nordic data centre rather than relying wholly on a hosted model from outside its jurisdiction. Its sustainability reporting follows national climate expectations and procurement criteria.
Hansa Mutual's cost questions are about allocation across entities. Its shared platform serves seven markets, so showback runs per entity as well as per use case, and the transfer price for platform services must be defensible to each subsidiary's board and, in regulated entities, to its supervisor. Its classification-routed hybrid set-up (Chapter 15) adds the cost of self-hosted models for sensitive information. As a large group it falls within corporate sustainability reporting, so its carbon calculation must use one method in every entity. Nordvik manages cost against a fixed budget; Hansa manages it against margins and an internal market between entities.
Summary
Cost and energy are architectural characteristics of AI systems, with the same claim to fitness functions, telemetry, and policy as any other. This chapter traced inference cost to its drivers, tokens, context, volume, model size, and GPU utilisation, and showed that each is governed by an architect's decision. Capacity planning, the serving-layer levers of caching, routing, and batching, and FinOps attribution to use case and team are expressed as artefacts in version control, enforced by the gateway at runtime and by the pipeline at change time.
The carbon footprint of AI varies by orders of magnitude with choices of model, hardware, location, and time. The Software Carbon Intensity specification gives a metric that rewards reduction and maps onto the same levers, and European reporting gives reason to measure it now. Public authorities must also fit consumption pricing into annual appropriations, which bounded cost policies and shared platforms make possible.
Several cost drivers, such as the price per token and the cost of leaving, are fixed at contract signature, which AI Governance, Chapter 7 treats. Evaluation, observability, and cost control pay off only for systems that reach production, and many never do. Chapter 23 closes Part V with that problem: why AI pilots stall, and how a platform offered as a product, golden paths, and a codified production readiness review turn experiments into an industrial capability.
Sources
- Nordqvist, G. (2025). Architecture as Code. The Transformed Architecture, Book 1, published at aac.geon.se. (72, Nordqvist, 2025)
- Green Software Foundation. Software Carbon Intensity (SCI) Specification (ISO/IEC 21031:2024).. (30, Green Software Foundation, 2024)
- Luccioni, A. S., Jernite, Y. & Strubell, E. (2024). Power Hungry Processing: Watts Driving the Cost of AI Deployment? Proceedings of the 2024 ACM Conference on Fairness, Accountability, and Transparency (FAccT '24). (49, Luccioni et al., 2024)
- Strubell, E., Ganesh, A. & McCallum, A. (2019). Energy and Policy Considerations for Deep Learning in NLP. Proceedings of the 57th Annual Meeting of the Association for Computational Linguistics, pp. 3645–3650. (47, Strubell et al., 2019)
- Patterson, D., Gonzalez, J., Le, Q., Liang, C., Munguia, L.-M., Rothchild, D., So, D., Texier, M. & Dean, J. (2021). Carbon Emissions and Large Neural Network Training.. (48, Patterson et al., 2021)
- International Energy Agency. Electricity 2024: Analysis and forecast to 2026. IEA, January 2024. (71, IEA, 2024)
- European Parliament and Council of the European Union. Regulation (EU) 2024/1689 laying down harmonised rules on artificial intelligence (Artificial Intelligence Act). Official Journal of the European Union, 12 July 2024. (1, European Union, 2024)
- Patil, C. (2026). Beyond Per-Token Pricing: A Concurrency-Aware Methodology for LLM Infrastructure Cost Estimation. arXiv:2606.11690 (preprint). (181, Patil, 2026)