Observability, Monitoring and Drift in Production
This chapter explains how to keep an AI system trustworthy after go-live. The evaluation in Chapter 20 shows that a system is fit for purpose on the day it is released; this chapter addresses the days after, when the incoming data changes, the relationship between inputs and the right answer shifts, and the metrics accepted at release quietly decay. Its observability stack, drift detection, quality monitoring, and incident process are connected to the monitoring obligations that Regulation (EU) 2024/1689, the AI Act, places on providers under Article 72 and on deployers under Article 26 (1, European Union, 2024), and to the GitOps principle from Architecture as Code that observed state must be compared continuously with desired state (72, Nordqvist, 2025).
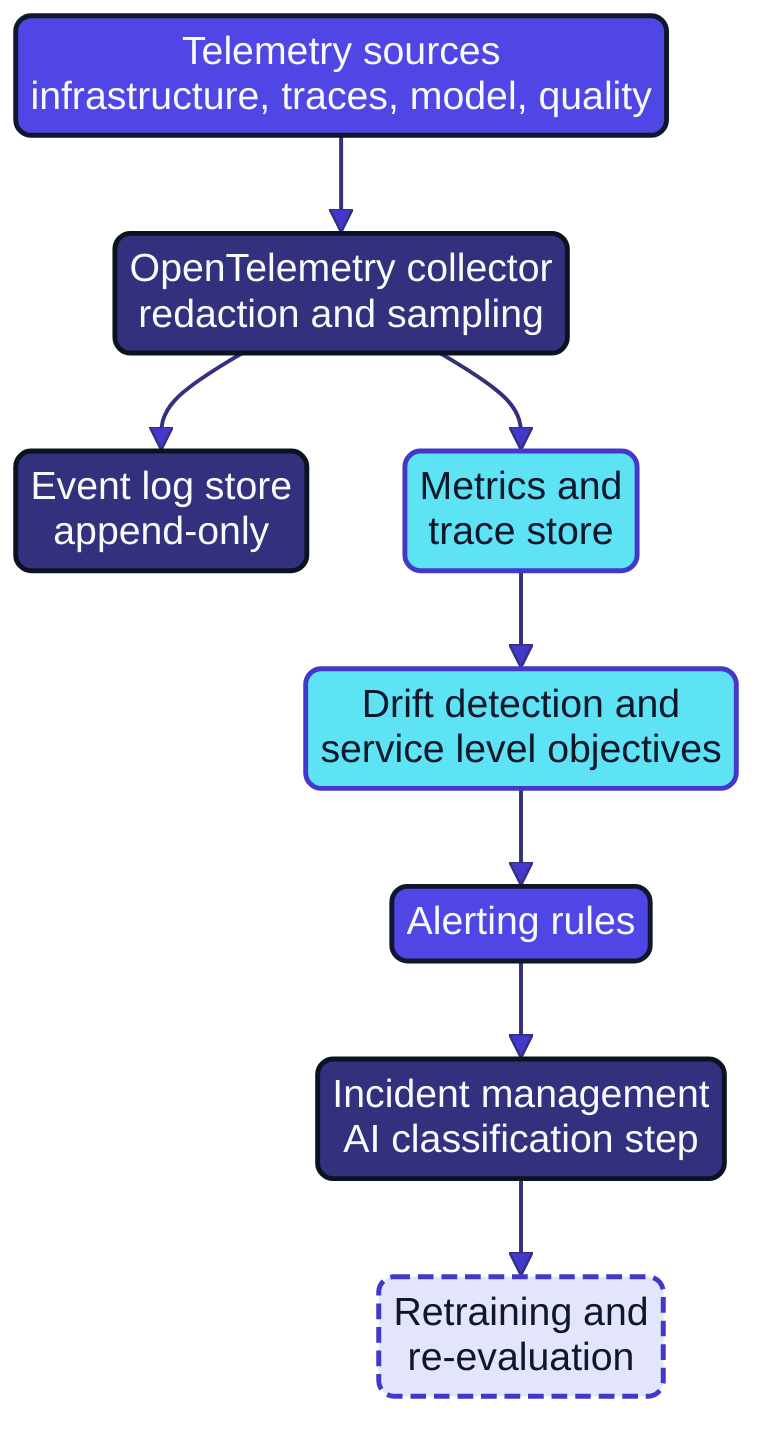
Figure 21.1: The observability stack collects infrastructure, service, model, and quality telemetry through an OpenTelemetry collector into retention-locked stores, feeds drift detection and service level objectives, and routes alerts into an incident process with an AI classification step and a path back to retraining.
Why models decay
A deployed model is a frozen summary of the past, while the world it was trained on continues to move. Data drift, or covariate shift, occurs when the distribution of inputs changes while the relationship between inputs and outputs stays the same: a claims classifier receives a new form layout after a policy change. Concept drift occurs when the relationship itself changes: the criteria for a benefit are amended, so the same claim should now be routed differently. Performance decay is the observable consequence of either, and it is what the organisation notices, usually late.
Gama et al. (69, Gama et al., 2014) offered a taxonomy that remains useful for architects. Drift can be sudden, incremental, gradual, or recurring, and each pattern calls for a different detection window and response. They distinguished real drift, where the conditional distribution of the target changes, from virtual drift, where only the input distribution changes. Huyen (74, Huyen, 2022) brought this into production practice by separating the signals an operator can observe: raw inputs, derived features, predictions, and, where labels arrive, accuracy-related metrics. The crucial constraint is that labels often arrive late or never. A fraud model learns the truth weeks after a transaction; a benefits eligibility model may never learn it unless a decision is appealed.
Sculley et al. (43, Sculley et al., 2015) added the systemic causes: unstable data dependencies, where an upstream producer changes a feature without notice; undeclared consumers, which silently depend on a model's output; and feedback loops, where a model influences the data it will be retrained on. Each shows up as drift, and none is detectable from inside the model; only observability of the surrounding system, as in Figure 21.1, reveals them.
The observability stack for AI
AI systems need the classical metrics, logs, and traces, carrying additional content, plus a fourth category: quality signals from human review and user feedback. The telemetry sources are infrastructure metrics such as GPU utilisation, queue depth, and latency; service traces that follow a request through the gateway, retrieval, inference, guardrails, and tool calls; model and data signals such as hashed inputs, outputs, confidence scores, token counts, and model and prompt versions; and quality signals.
An OpenTelemetry collector redacts personal data, samples high-volume traces, and routes the record of events to an append-only store with retention locks, as AI Governance, Chapter 11 describes for the Article 12 logging obligation (1, European Union, 2024). Metrics and traces go to the ordinary observability back end, where they are cheap to query and age out quickly. The separation matters, because the event log store is evidence that lives for the regulatory period, whereas the metrics store is operational. Analysis then consists of the drift detection job, the service level objectives, and the alerting rules; response is the incident process, with an AI-specific classification step and a path back to retraining that closes the loop with Chapter 7 and Chapter 20.
OpenTelemetry semantic conventions for generative AI
The OpenTelemetry project maintains semantic conventions for generative AI (34, OpenTelemetry, n.d.) that define span attributes such as the operation name, the provider, the requested and actual model, token counts, and finish reasons, together with metrics for token usage and duration. The conventions are still in development, so adopt them through one shared instrumentation library behind the AI gateway of Chapter 12, where a rename is a single change.
The conventions make the capture of prompt and completion content optional, and that default is right for Europe. A citizen's conversation with a public service chatbot is personal data; the fact that an inference occurred, with which model, at what cost, and with what outcome, is not. The collector configuration below therefore hashes content in both pipelines and sends model spans to the retention-controlled store.
receivers:
  otlp:
    protocols:
      grpc:
        endpoint: 0.0.0.0:4317
processors:
  attributes/redact-content:
    actions:
      - key: gen_ai.input.messages
        action: hash
      - key: gen_ai.output.messages
        action: hash
      - key: enduser.id
        action: hash
  probabilistic_sampler/traces:
    sampling_percentage: 10
  batch: {}
exporters:
  otlp/observability-backend:
    endpoint: otel-backend.internal:4317
  file/event-log:
    path: /var/evidence/ai-events.jsonl
service:
  pipelines:
    traces/operational:
      receivers: [otlp]
      processors: [attributes/redact-content, probabilistic_sampler/traces, batch]
      exporters: [otlp/observability-backend]
    traces/evidence:
      receivers: [otlp]
      processors: [attributes/redact-content, batch]
      exporters: [file/event-log]
The evidence pipeline is not sampled, because Article 12 requires the automatic recording of events over the system's lifetime, and a ten per cent sample is not a record. The operational pipeline is sampled, because a trace store is not an evidence store and its cost should match its purpose.
Across the usage modes
The stack assumes that every model call passes through infrastructure the organisation operates. Read against Chapter 2's usage-mode matrix, that holds fully only for some modes; in the others the organisation sees what the vendor chooses to log, or nothing.
| Usage mode | Telemetry available | Gap to close |
|---|---|---|
| Mode 0 Ambient AI | None, as a rule | Inventory the features; observe outcomes, not calls |
| Mode 1 Conversational assistants | Vendor audit logs, sometimes conversation export | No quality or drift signal; add proxy logs and user feedback |
| Mode 2 Embedded workplace assistants | Vendor audit records, where offered | Feed them to security monitoring; no model or retrieval detail |
| Mode 3 Agentic work tools | Tool logs, version control, endpoint and egress telemetry | Capture tool calls centrally, outside the agent's write access |
| Mode 4 Built AI applications | Full telemetry including retrieval sources and quality signals | The full stack in this chapter |
| Mode 5 Autonomous production agents | Full telemetry plus per-run agent traces and policy decisions | Trace propagation into systems of record, tamper-evident logs |
In Modes 0 to 2 drift arrives as a vendor's model update, observed by re-running the evaluation scenarios of Chapter 20. For high-risk deployments, Article 26(6) of the AI Act requires the deployer to keep the automatically generated logs only to the extent they are under its control (1, European Union, 2024), which makes the contract and the tenant configuration the place where log access is decided.
Tracing agent actions
Chapter 11 argued that an agent's autonomy is bounded by explicit permissions; observability is how that boundary is verified in production. Each agent run is a trace, and each model call, tool call, retrieval, and guardrail decision is a span carrying the identity under which the action was taken, the tool and parameters, the permission that authorised it, and the result. A run that exceeds a step budget, invokes a tool outside its allow-list, or escalates privilege therefore produces a span an alerting rule can match.
Trace context must propagate into the systems of record a tool call touches, because delegated authority without traceability is the failure mode Chapter 16 identified as the agent's most dangerous. Moreover, the trace of an agent run is the natural unit of record for the Article 12 log and the deployer's monitoring duty under Article 26, because it answers what the system did, on whose behalf, and why.
Detecting drift
Drift detection compares a reference window, typically the evaluation dataset or the first weeks after release, with a rolling current window, and raises a signal when the difference exceeds a threshold. Input drift is compared per feature or embedding dimension, using the population stability index, the Kolmogorov–Smirnov statistic, or a divergence between embedding distributions. Prediction drift is compared on the distribution of outputs and confidence scores. Concept drift requires labels, and where labels arrive late the detection is late too, which is why the indirect input and prediction comparisons matter.
The detection job is code, scheduled, versioned, and tested. The following definition runs daily against Nordvik Region's claims-routing classifier, the scoring component of the benefits-triage system whose evaluation suite Chapter 20 defined.
apiVersion: monitoring.aiarch.example/v1
kind: DriftDetectionJob
metadata:
  name: claims-routing-drift
  system: claims-routing-classifier
  owner: benefits-decision-support-team
schedule: "0 4 * * *"
reference:
  source: s3://evaluation/golden/claims-routing@sha256:c21e...
  refreshPolicy: on-release
current:
  source: eventlog://claims-routing-classifier
  windowDays: 7
  minimumSamples: 2000
checks:
  - id: input-drift
    kind: feature-distribution
    features: [document_type, claim_amount_band, region, language]
    statistic: population-stability-index
    warn: 0.10
    alert: 0.25
  - id: prediction-drift
    kind: output-distribution
    field: predicted_route
    statistic: jensen-shannon-divergence
    alert: 0.08
  - id: delayed-label-accuracy
    kind: labelled-performance
    labelSource: eventlog://claims-routing-appeals
    labelDelayDays: 45
    metric: accuracy
    alert: 0.92
actions:
  onWarn: [annotate-dashboard, notify-owner]
  onAlert: [page-on-call, open-incident, attach-evidence]
The job writes results to the metrics store and its report to the evidence store as a post-market monitoring artefact. Its thresholds are the same values that appear in the post-market monitoring plan in the Annex IV documentation (1, European Union, 2024), which AI Governance, Chapter 11 shows being generated from the repository on every release; consequently, tightening a threshold in this file changes the documentation with it.
Quality monitoring with sampled human review
Statistics show that something has changed, but not whether the system is still right; for that, a person must look at outputs. The sampling design follows the human evaluation layer in Chapter 20: a baseline random sample, stratified over the slices that matter for fairness, plus over-sampling of low-confidence outputs, guardrail triggers, poorly rated outputs, and every operator override. Reviewers record verdicts against a fixed rubric, and the verdicts become labels for the delayed-label accuracy check and, eventually, the golden dataset.
Feedback loops need particular care. Huyen (74, Huyen, 2022) describes degenerate feedback loops, where a system's outputs shape the behaviour that generates its future training data. In a public authority the analogue is a decision support tool whose suggestions case officers accept by default, so that recorded decisions converge on the model's output and accuracy measured against them becomes meaningless. The countermeasure is to record whether the human decided with or without seeing the suggestion, and to keep a small blind sample where officers decide first. Without it the authority cannot show, as Article 14 of the AI Act requires, that human oversight is effective rather than nominal.
Service level objectives for probabilistic services
A probabilistic service needs the usual availability and latency objectives, plus quality objectives stated in the metrics it was evaluated on. The following indicators have proved workable for an LLM-based service behind an AI gateway.
| Indicator | Definition | Example objective |
|---|---|---|
| Availability | Successful responses over total requests, excluding client errors | 99.5 per cent over 30 days |
| Latency | Time to first token and to complete response | 95th percentile under 2 and 12 seconds |
| Grounding rate | Share of sampled responses supported by retrieved sources | At least 97 per cent per week |
| Human agreement | Share of reviewed outputs rated acceptable | At least 95 per cent per week |
| Drift budget | Days per quarter with any drift check in alert state | At most 3 |
| Cost per request | Tokens and compute attributed per request | Within the budget in Chapter 22 |
Quality indicators depend on human review, so they are measured weekly; report the confidence interval and sample size, not only the point estimate. An error budget works as it does for conventional services: when the grounding rate exhausts its budget, the team stops feature work on prompts and the retrieval corpus until it recovers, and records that decision. Nordvik Region defines each indicator once as a recording rule, with the objective carried as a label, so that dashboards, alerts, and the quarterly SLO report read the same computation.
Alerting rules
Alerts translate indicator breaches into action. The rules below, for a Prometheus-compatible engine, refer to metrics emitted by the drift job and the gateway's instrumentation.
groups:
  - name: claims-routing-ai
    rules:
      - alert: AIInputDriftHigh
        expr: ai_drift_statistic{system="claims-routing-classifier",check="input-drift"} > 0.25
        for: 1d
        labels:
          severity: page
          ai_system: claims-routing-classifier
        annotations:
          summary: Input distribution has drifted beyond the alert threshold
          runbook: runbooks/claims-routing/drift.md
      - alert: AIAgentToolDenied
        expr: increase(ai_agent_tool_denied_total{system="maintenance-agent"}[15m]) > 5
        for: 0m
        labels:
          severity: page
          ai_system: maintenance-agent
        annotations:
          summary: Agent repeatedly attempted tools outside its allow-list
          runbook: runbooks/maintenance-agent/permissions.md
Every alert carries the AI system's identifier, so the incident process can look up its risk class, owner, and evidence manifest automatically.
Worked example: drift runbook
Illustrative example. The AIInputDriftHigh alert links to the runbook below, which Nordvik Region keeps beside the drift job. It is written for an on-call engineer who does not know the classifier well, so every step names the check and the decision it informs.
# Runbook: claims-routing input drift (runbooks/claims-routing/drift.md)

Alert: AIInputDriftHigh (PSI > 0.25 for 1 day)   Severity: page
System: claims-routing-classifier   Risk class: high-risk (Annex III, 5(a))

1. Confirm: note which features exceed 0.25 and since when; check that the
   minimum sample size (2000) was met, else downgrade to ticket and stop;
   check the change calendar for a known cause.
2. Assess: if predictions and confidence are stable, treat as likely virtual
   drift and go to step 4. Otherwise run impact query IQ-03 and request an
   expedited human review of 100 recent cases from the affected slice.
3. Contain: while review is pending, raise human review for the slice to
   100% via flag `review_all_slice=<slice>`. If wrong routing exceeds 5% or
   a legislative change altered the criteria, page the incident manager and
   start the AI incident runbook (RB-AI-000).
4. Close: record cause, decision, and evidence links. Any threshold change
   goes through a pull request to the drift job, never a silenced alert.
The runbook answers the two questions the alert cannot, whether the drift is real and whether it matters, using indirect signals first because labels arrive forty-five days late. Forbidding silenced alerts keeps the thresholds aligned with the post-market monitoring plan.
Incident management for AI
An AI incident differs from a conventional one in two ways. The cause may be gradual, so there is no deployment to roll back; and the consequence may be a stream of individually plausible but wrong outputs, so impact is measured in affected decisions rather than minutes of downtime. The incident process therefore needs three additions.
The first is an AI classification step. For every incident touching an AI system, the incident manager records whether the system is high-risk, whether the incident meets the definition of a serious incident in Article 3, and the reasoning. As AI Governance, Chapter 11 develops, Article 73 gives a provider fifteen days from awareness to report a serious incident to the market surveillance authority, and, under Article 26(5), a deployer that has identified a serious incident must immediately inform the provider first (1, European Union, 2024). A deployer must also, under Article 26, monitor the system on the basis of the instructions for use, inform the provider and authorities when it considers that the system presents a risk, and suspend use (1, European Union, 2024). Suspension is thus an architectural requirement: there must be a tested switch, and the fallback path, usually manual processing, must absorb the load.
The second is an impact query listing which decisions each model version made in which period, for remediation; this is why the Article 12 record must be complete and unsampled. The third is the path back to evaluation, because an AI incident almost always ends with a change to the golden dataset, the evaluation suite, or the drift thresholds.
For a social insurance authority whose classifier misroutes a class of claims for three weeks after a legislative change, detection in two days, suspension within hours, and an event log listing every affected claim turn a crisis into a controlled correction. Financial entities additionally carry Articles 17 and 19 of Regulation (EU) 2022/2554, DORA, on ICT incident management and the reporting of major ICT-related incidents, so the classification step asks both questions and records both answers.
Worked example: AI incident runbook
Illustrative example. The runbook below is Nordvik Region's generic runbook for incidents involving any system in its AI register, invoked from system-specific runbooks such as the drift runbook. It covers Nordvik Region both as deployer of the procured classifier and as provider and deployer of the explanations service it built in house. The notification timelines are an architectural reading for planning, not legal advice; the legal function confirms each classification.
# Runbook: AI incident (RB-AI-000, version 2.2)

D1. Open a ticket; the `ai_system` label attaches risk class, owner,
    provider/deployer role, and evidence manifest. Record awareness time T0.
T1. Within 2 hours: name affected versions; run impact query IQ-01;
    classify harm; set SEV1 if decisions about persons may be wrong at
    scale, personal data was disclosed, or an irreversible action occurred.
C1. Narrow first: 100% human review, disable agent write tools, or remove
    the affected retrieval collection, via feature flags.
C2. Suspend if C1 is insufficient: flag `ai_suspended=true` switches to the
    manual fallback path (AI Act Art. 26(5)).
C3. Preserve evidence before any retraining, re-indexing, or threshold change.

| Instrument and article | Question | If yes |
|---|---|---|
| AI Act Art. 73 (provider) | Serious incident per Art. 3(49)? | Authority within 15 days; 10 if a death; 2 if widespread or critical infrastructure |
| AI Act Art. 26(5) (deployer) | Risk in a bought-in system? | Inform the provider without undue delay |
| NIS 2 Art. 23 | Significant incident? | Early warning 24 h; notification 72 h; final report 1 month |
| GDPR Art. 33 | Personal data breach? | Supervisory authority within 72 h |

R1. Fix through the normal pipeline; resume only on a passing evaluation
    gate and business owner approval; remediate decisions from IQ-01.
P1. Within 10 working days: blameless review, one new golden dataset
    record and regression case, review filed as post-market monitoring input.
T0 is recorded at detection, because every regulatory clock runs from awareness and a time reconstructed later will be reconstructed generously. Every notification row is assessed and recorded in parallel with containment, so that the organisation can show a regulator why NIS 2 (4, European Union, 2022), the GDPR (2, European Union, 2016), and, for financial entities, DORA (3, European Union, 2022) did or did not apply.
Nordvik Region and Hansa Mutual
Nordvik Region's drift runbook and AI incident runbook concern the benefits-triage system and the explanations service around it. Drift after a change in national benefit rules shows up first in the input-drift alert, and notifications run through one jurisdiction: the supplier under Article 26(5) of the AI Act (1, European Union, 2024), the national data protection authority, and the national CSIRT where NIS 2 applies. Citizen complaints and appeals are monitoring signals in their own right.
Hansa Mutual's observability is shared across entities, so every trace and metric carries the entity and market it serves; drift can be local, such as a new motor product in the Netherlands, while the group dashboard looks stable. Its runbook has a notification path per jurisdiction: EU entities report major ICT-related incidents to their national financial supervisors under DORA Article 19 (3, European Union, 2022), the Norwegian entity follows EEA incorporation, and the United Kingdom and Swiss entities report to their own authorities, the Swiss under the revised Federal Act on Data Protection (244, Swiss Confederation, 2020). Nordvik's runbook has one row per instrument; Hansa's has one per instrument per entity.
Summary
Models decay because the world changes and the model does not. Data drift alters what arrives, concept drift alters what is right, and the hidden dependencies and feedback loops of a real system ensure that neither is visible from the model alone. The answer is an observability stack that separates the regulatory record of events from operational traces, drift detection whose thresholds are shared with the post-market monitoring plan, quality objectives measured by sampled human review, and alerts that carry the system identity into the incident process.
An incident process for AI needs three additions: a classification step that answers the AI Act's serious incident question and DORA's major incident question in time, an impact query that lists affected decisions from the event log, and a closure step that feeds the evaluation suite. Each produces evidence for the chain described in AI Governance, Chapter 11.
Every signal collected and every model kept running consumes money and energy, which Chapter 22 treats as architectural constraints.
Sources
- European Parliament and Council of the European Union. Regulation (EU) 2024/1689 laying down harmonised rules on artificial intelligence (Artificial Intelligence Act). Official Journal of the European Union, 12 July 2024. (1, European Union, 2024)
- Nordqvist, G. (2025). Architecture as Code. The Transformed Architecture, Book 1, published at aac.geon.se. (72, Nordqvist, 2025)
- Gama, J., Žliobaitė, I., Bifet, A., Pechenizkiy, M. & Bouchachia, A. (2014). A survey on concept drift adaptation. ACM Computing Surveys, 46(4), Article 44. (69, Gama et al., 2014)
- Huyen, C. (2022). Designing Machine Learning Systems: An Iterative Process for Production-Ready Applications. Sebastopol, CA: O'Reilly Media. ISBN 978-1-0981-0796-3. (74, Huyen, 2022)
- Sculley, D., Holt, G., Golovin, D., Davydov, E., Phillips, T., Ebner, D., Chaudhary, V., Young, M., Crespo, J.-F. & Dennison, D. (2015). Hidden Technical Debt in Machine Learning Systems. Advances in Neural Information Processing Systems 28 (NeurIPS 2015). (43, Sculley et al., 2015)
- OpenTelemetry Authors. OpenTelemetry Documentation, including the Semantic Conventions for Generative AI systems. Cloud Native Computing Foundation. (34, OpenTelemetry, n.d.)
- European Parliament and Council of the European Union. Directive (EU) 2022/2555 on measures for a high common level of cybersecurity across the Union (NIS 2 Directive). Official Journal of the European Union, 27 December 2022. (4, European Union, 2022)
- European Parliament and Council of the European Union. Regulation (EU) 2016/679 on the protection of natural persons with regard to the processing of personal data (General Data Protection Regulation). Official Journal of the European Union, 4 May 2016. (2, European Union, 2016)
- European Parliament and Council of the European Union. Regulation (EU) 2022/2554 on digital operational resilience for the financial sector (DORA). Official Journal of the European Union, 27 December 2022. (3, European Union, 2022)
- Swiss Federal Assembly (2020). Federal Act of 25 September 2020 on Data Protection (Data Protection Act, FADP), SR 235.1. Fedlex, in force 1 September 2023. (244, Swiss Confederation, 2020)